What Does a Living Building Actually Cool?
A hotter climate will put shade on a different timetable. What matters for a commuter in Singapore, a factory owner in Sydney and a family walking to a Los Angeles bus stop depends on where the heat goes.
Published November 19, 2026Analysis / Biourbanism / Sustainable Infrastructure
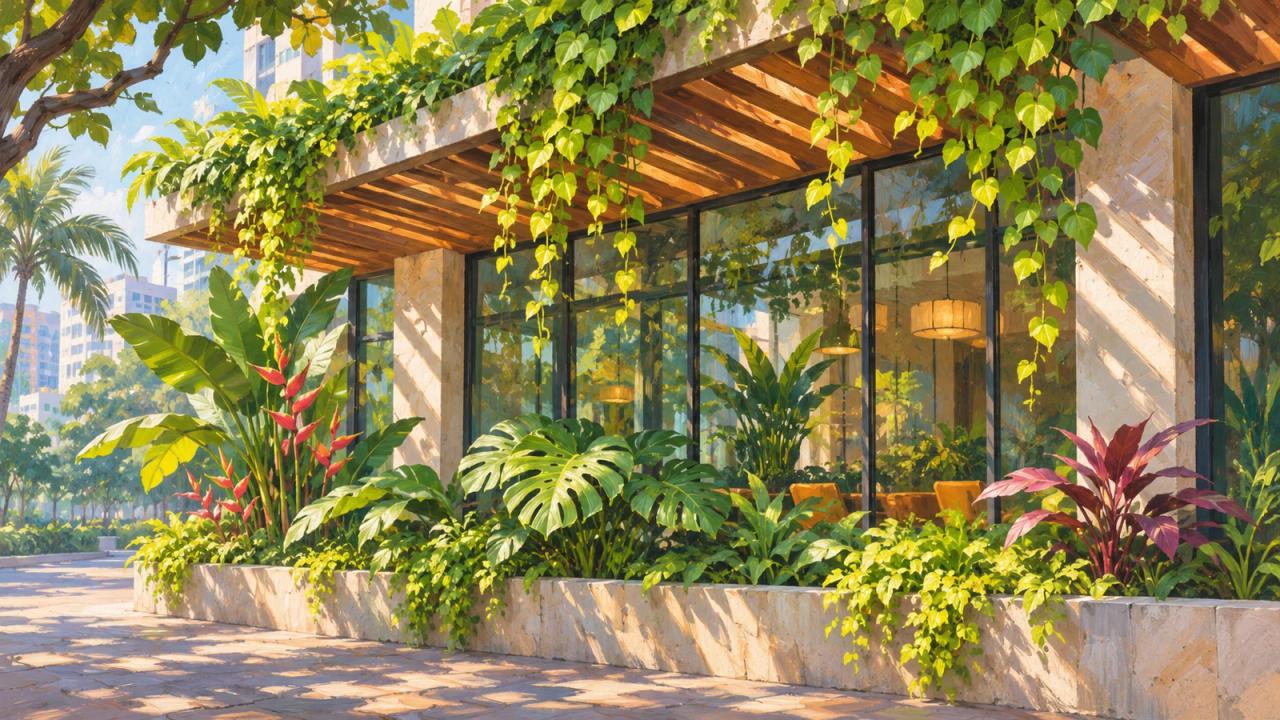
On the north side of a building in Singapore’s one-north district, a project team recorded temperatures reaching 32.7°C beside concrete. Readings near the greenery stayed below 30°C. The new garden covers about 1,035 square meters of façade. The release gives an encouraging result for someone standing at the building and remarkably little information about what that person would feel. It specifies neither the sensor placement nor whether the instruments measured air or surfaces. [1]
Singapore’s Third National Climate Change Study gives that distinction some urgency. Against its 1995–2014 reference climate, the study lists a historical average of 21.4 days a year with a daily maximum above 35°C. Under the high-emissions pathway SSP5-8.5, the central projection for 2040–2059 is 129 such days per year, with a model range of 76 to 189. Under low emissions, the mid-century estimate is 73. An entrance used to shelter people on a few unusually hot afternoons may have to do that work for months. The regional climate projections describe the frequency of heat. They cannot be subtracted from a sensor reading beside a wall. Singapore V3 report, table 5.5
Western Sydney faces a different climate. Relative to 1990–2009, the New South Wales regional projections put the Metropolitan Sydney rise in annual mean air temperature at 1.4°C around 2050 and 2.4°C around 2090 under medium emissions. The high-emissions estimate for 2090 is 3.4°C. Averaging winter nights with summer afternoons masks how heat is experienced. In the historical baseline, parts of western Sydney already averaged ten to fifteen days a year reaching at least 35°C. A regional mean does not specify how hot the aluminum on a particular roof will get. NSW Metropolitan Sydney climate snapshot
Climate change shifts the background against which the whole city experiences weather. The urban heat island describes a different comparison, between a built area and its surroundings under comparable weather. Masonry and pavement can store energy by day and release it after sunset. Shade along one block changes how much radiation reaches people and surfaces there. All three effects can matter on the same walk home. A city deciding where to spend its adaptation money needs measurements that distinguish them.
At the foot of the wall
GWS Living Art and Vidacity unveiled the Singapore façade in October 2026. The designers chose plants for the sunlight and exposure each part of the building receives. They reported that the readings around the planting were about 1°C cooler on average over the course of the day across the elevations they monitored. Researchers from the National University of Singapore are involved in studying how the plants and irrigation hold up. [1]
Leaves shade a surface that would otherwise absorb sunlight. When water evaporates from leaves and soil, it draws heat from the surroundings. A shaded wall can radiate less heat toward someone standing nearby, even when a thermometer in the open air shows a smaller change. Sun on the skin, heat from the ground, humidity and moving air all contribute to how that place feels. [4]
For a building owner asking whether the façade makes an entrance more comfortable, the most useful readings would be taken where people actually stand, at the hours when they use it. The project team’s early release describes sensors around the wall but gives little detail about placement or how readings varied with weather. A matched stretch of concrete and a simple shade canopy would help establish how much of the benefit comes from the planting itself. [1]
A Singapore experiment by Chun Liang Tan, Nyuk Hien Wong and Steve Kardinal Jusuf gets closer to the pedestrian’s experience. The researchers monitored the space between two walls, taking readings at half-meter intervals up to two meters away. When they removed the greenery from one wall, peak mean radiant temperature half a meter from that wall rose by roughly 11–13°C and arrived around 5 p.m., two hours later than before. Mean radiant temperature describes the combined radiant heat a person exchanges with surrounding surfaces. The afternoon sun can go behind a building while a sun-warmed wall continues to heat the people waiting beside it. [7]
That earlier experiment gives the one-north readings a practical use. A person passing through the entrance may spend seconds there. Someone waiting for a ride may stand beside the same wall for fifteen minutes at the end of the day. The experiment suggests a reason to measure radiant heat at the waiting place through the evening commute, even if the project team’s sensors show their largest temperature difference much earlier. The two studies measured different quantities. Adding their numbers would tell us nothing about the passenger.
When a planted wall runs warmer
At Delft University of Technology, Ruchira Sharma tested several planting systems along the west side of the same building. During office hours in the late-June 2026 study period, two sections averaged 1.46°C and 1.03°C warmer than their bare-wall references in the dedicated sensor measurements. Probe position mattered, including when comparing those instruments with other sensors. A weak relationship with background weather does not identify which process caused the difference. Isolating ventilation would require air-movement measurements and comparably placed probes. The finding matters precisely because a building owner could install the same instruments on a different face and get a different answer. Delft thesis, thermal results and probe comparisons
Sharma also asked what the wall was being hired to do. The specialist and occupant profiles weighted cooling heavily, while the ecologist gave most weight to habitat. The thesis developed a scoring method and tested its thermal component. Acoustics, air quality and biodiversity still awaited validation. Those priorities explain how people might choose a façade. They do not establish that any of the designs delivered cleaner air or quieter rooms. Delft thesis
Above the factory
At Bradfield City’s First Building, researchers from the University of Technology Sydney placed temperature loggers around the roof and used infrared cameras to compare surfaces. The cameras found that the faces of panels over the planted area were about 3°C cooler on moderately hot and hot days. Table 3 compares the surface of shaded vegetation with the surface of conventional aluminum roofing. The difference between those surfaces reached 28°C in the very-high-heat category. [2]
Hot solar cells tend to generate less power from the same amount of light. The researchers fed panel-temperature readings and local sunlight data into a model to estimate the effect. Across the 28-day study in late 2025, the model estimated that an individual panel over the planted section yielded 11.1% more electricity per day on average than one over the conventional roof. The difference was greatest on bright days and small on overcast days. A year of direct metering would show how the result carries through changing weather and seasons. [2,3]
Extra electricity is only one item on the roof’s balance sheet. This design also requires a growing medium, drainage, waterproofing, access for plant care and a dependable water supply. A building owner considering a retrofit would need to know whether the roof can carry the wet weight, what irrigation costs in a dry summer, and whether workers can reach both the plants and panels without damaging either. A conventional solar roof starts with fewer of those demands. [2,4]
The Bradfield report puts the modeled gain in units a building manager can recognize. It estimated 2.44 kilowatt-hours per panel per day over the planted roof and 2.20 over aluminum. The difference, 0.24 kilowatt-hours, has a financial value that depends on when the building could use or sell that electricity. A day when the factory buys power through the afternoon is different from one when it already exports its surplus. Multiplying the result by every panel and every day of the year would assume the exposure and weather the researchers were trying to measure. A paired electricity meter on each section would be a better investment decision tool. [2]
What the camera and the electricity meter see
In a University of Technology Sydney poster, a thermal image of a planted Parramatta parklet has a color scale running from 25.9°C to 48.3°C. Subtracting the endpoints gives 22.4 degrees, but the scale does not label two matched measurement points. The group’s separate field poster supplies the defensible comparison. Using thermal imaging and loggers, it reports local surface-temperature reductions of up to 17°C in Parramatta and 25°C in Auburn. Its instruments included a logger 60 centimeters above the growing medium, one on the bark layer and one buried 20 centimeters down. Each sees a different part of the parklet. None of those maxima is a reduction in neighborhood air temperature. Field poster with instruments and results · Parramatta infrared image
On the same research program’s building poster, the ten-story office model tells a counterintuitive story. Its top-floor heat-addition component for opaque-surface conduction and other heat increases from 0.004 gigajoules with the conventional roof to 0.007 with the green roof. A difference of three thousandths of a gigajoule looks large expressed as a percentage of four thousandths. It does not amount to a 75% saving. In the thirty-story example, the direction reverses. The top-floor component falls from 0.006 to 0.001 gigajoules, but the whole-facility figure moves only from 6.535 to 6.518. The poster labels its monthly heating and cooling loads separately. Neither set of model outputs is a building electricity bill. UTS simulation poster, lower-right table and chart
An earlier Sydney study by Fleck and colleagues compared two similarly constructed buildings with solar roofs. Its modeled average hourly solar output was 4.5% higher for the planted roof. Bradfield’s 11.1% estimate is a daily per-panel average for its own 28-day study period. Their agreement on direction is interesting. Their different magnitudes show why an owner should ask for a season of matched meter readings, differences in shading and panel orientation, and simultaneous weather records before pricing the benefit. Neither percentage guarantees an increase on another building. Sydney paired-building paper
A lawn above a dam
At Marina Barrage, a dam across the mouth of Singapore’s Marina Channel, low tide lets gates drain excess rainwater to the sea. At high tide, pumps do the job. The dam keeps seawater out of a freshwater reservoir, and its visitor building gives people a place to fly kites on a broad rooftop lawn. The grass and soil shade and insulate the roof. Singapore’s water agency reports that they lower the maximum surface temperature by 3°C. The temperature reading describes the roof. The gates and pumps provide flood protection. [5]
Seoul measured cooling at a different scale after it uncovered the Cheonggyecheon stream. A research team took readings before, during and after the restoration, along the water and on nearby streets. It estimated that near-surface temperatures across its study area were about 0.4°C lower afterward. The researchers cautioned that the weather changed between the periods. Their choice of sites is useful for anyone designing cooler places to walk: they checked the corridor people use and the streets it connects to. [6]
Shade that reaches the person who needs it
In Tempe, Arizona, researchers spent selected clear, calm days across four seasons measuring conditions and interviewing 1,284 people along a pedestrian mall. Shade lowered the average sensation of heat by about one point on a nine-point scale. People under trees and people under a photovoltaic canopy reported no significant difference in comfort attributable to the shade type. The improvement held outside winter. A city facing an exposed queue this summer can act on that finding years before a newly planted tree grows a crown. In humid Singapore the same structure would meet different wind and moisture conditions, so the Arizona result supplies a comparison to test locally. Middel and colleagues, seasonal pedestrian study
Consider a family walking to a bus stop between Hawthorne and Gardena in Los Angeles County. A roof garden several stories above the street could cool the building beneath it while the family still walks in direct sun. A well-placed tree can shade the approach, the pavement and the bench. A shelter can give the bench dependable shade sooner and without irrigation. At a crossing, the relevant question is whether either alternative actually shades the place where people stand at the hour they cross. Los Angeles County’s public-health department identifies underserved neighborhoods with fewer trees and less shade as a priority. Counting minutes of protected walking or waiting would show which residents a planting program actually reaches. Los Angeles County public health
The delivery costs start underfoot. Roots need water and oxygen. An obstructed drain can leave growing medium wet while roots are struggling, so an operator responding to a distressed plant by adding more water can make the problem worse. On a structural deck, wet growing medium also adds weight. For scale, thirty cubic meters at an assumed saturated density of 1,600 kilograms per cubic meter weighs 48 metric tonnes before the tree or container. The water is already included in that calculation. Ground planting can avoid that deck load where sufficient rooting space is available. In a fully paved corridor, space to inspect the drain or replace the planter must compete with the space left for pedestrians.
The water bill follows the seasons. Evaporation and transpiration carry heat away as water changes phase. During a drought, a plant that restricts water loss can continue casting shade while delivering less evaporative cooling. Irrigating it from a potable supply transfers part of the adaptation cost to the water system precisely when demand is high. Captured runoff is an alternative where the site can store or replenish enough suitable water between storms. A fair comparison would meter irrigation through the dry season and record whether the canopy survives it. It would also budget for the interval between the loss of a mature tree and the day its replacement shades the same patch of ground. EPA on trees and vegetation
A reflective roof offers a different bargain for a building with limited carrying capacity or little water. It can reject more incoming sunlight without supporting saturated soil, buying irrigation water or sending a crew up to prune. Its value depends on the existing roof color, insulation, local weather and heating demand in winter. A planted roof earns its additional requirements where the owner also needs habitat, stormwater storage or usable outdoor space and can maintain those functions. A solar canopy earns its posts and foundations where people need overhead shade now and the electricity has a buyer. The useful comparison begins with the same service, at the same time of day, over the same years of maintenance. U.S. Department of Energy, cool roofs
What happens to the rain after the roof is full?
Cooling alone can be a modest return on a planted roof. In Shenzhen, researchers modeled an eleven-story apartment building with 600 square meters of roof. They estimated that planting it would save 10,125 kilowatt-hours a year compared with conventional concrete, about 5.9% of the building’s annual energy use. A reflective roof might also cut cooling demand. Where a city needs to manage stormwater, the fairer cost comparison includes what it would take to collect, treat and store runoff under either design. Shenzhen energy study, table 3
Follow ten millimeters of rain onto that 600-square-meter roof. Six thousand liters arrive. Some stay in the growing medium and sustain the plants. Some eventually return to the air. Only the water that drains to a collection point can fill a tank for later use. A conventional roof feeding a cistern might deliver more water from the same storm. The planted roof can put part of the rain to work immediately and slow the flow reaching the drains. Counting all six thousand liters as both irrigation stored for summer and water consumed in cooling would spend the same storm twice.
That distinction is central to Gardens of Earth: Vascular Los Angeles and the Biourban Future, by Eric Storm. In the book’s proposed Hawthorne-to-Gardena pilot, runoff enters a settling bay where grit can drop out before the water passes through replaceable filter media in an accessible gallery. Sampling points let an operator check treatment performance. Water that meets the requirements for its intended use can be held in storage for later irrigation. Larger flows need a safe route past the treatment bays. The design connects two events that can be months apart in Los Angeles: a winter storm that sends water down a channel and a summer afternoon when a shade tree needs a drink. JetsonsAge’s feature on the design
The most revealing meter would be on the irrigation outlet. How many liters of treated stormwater actually reached trees during the dry season, and how much purchased water did that displace? Set that beside the cost of tank capacity, testing, pumping and replacing filter media. A gallery could prove worthwhile on those terms even where the electricity saving alone is small. It would also show where a simple collection tank serving an ordinary roof could do the same job for less.
Gardens of Earth studies how Los Angeles could use captured runoff to sustain shade along streets and public paths. Its interactive research tools let readers change assumptions about how much water a tree canopy needs and how heavy its growing medium becomes when saturated. Gardens of Earth · Explore the research
Volume I follows the water and infrastructure beneath the city. Volume II looks at the shade and mobility people experience above ground, who pays for those systems, and how proposed pilots could test them. Volume I on Kindle · Volume II on Kindle · Book editions and audiobook previews
Disclosure: Eric Storm, curator of JetsonsAge.com, is the author of both volumes.
Where the cooling is needed
For a hot walk to a station, a tree, a canopy and a planted wall should be judged at sidewalk level. The first question is how much shade each puts over the route when the pavement is hottest. For a factory roof, the comparison belongs at the panels, at the electricity meter and in the bills for water and maintenance. A greener roof can do several jobs on the same piece of real estate. Before putting plants on the next building, a city can ask which job is worth paying for and put the sensors where that work takes place.
For a Hawthorne-to-Gardena pilot, a useful first result could fit on a bus-stop timetable. At the hour school lets out and again at the evening commute, compare the planted waiting area with a nearby exposed stop and a stop under an ordinary shelter. Repeat the measurements through a hot spell. Alongside them, publish the irrigation meter reading, days the shade was unavailable and time spent tending the planting. A shelter might deliver the earliest improvement, while a tree could eventually shade the approach as well as the seat. That is a decision a neighborhood can make with evidence. It does not have to wait for anyone to prove that Los Angeles as a whole got cooler.
Sources
1. GWS Living Art and Vidacity: Singapore façade launch and early sensor readings, October 30, 2026
3. University of Technology Sydney: Bradfield roof research summary, August 10, 2026
4. U.S. Environmental Protection Agency: Benefits of Trees and Vegetation
5. Singapore PUB: Marina Barrage and its flood-control operations; green-roof features
6. Yeon-Hee Kim and colleagues: Field observations of Seoul’s restored stream, 2008