Data Centers' Gas Plans Could Decide Whether Power-Sector Emissions Keep Falling
Developers have proposed 177 gigawatts of gas capacity associated with data centers. What that means for emissions depends on how many plants get built, how long they run and how quickly cleaner power arrives.
Published November 3, 2026Analysis / Energy / Grid Technology
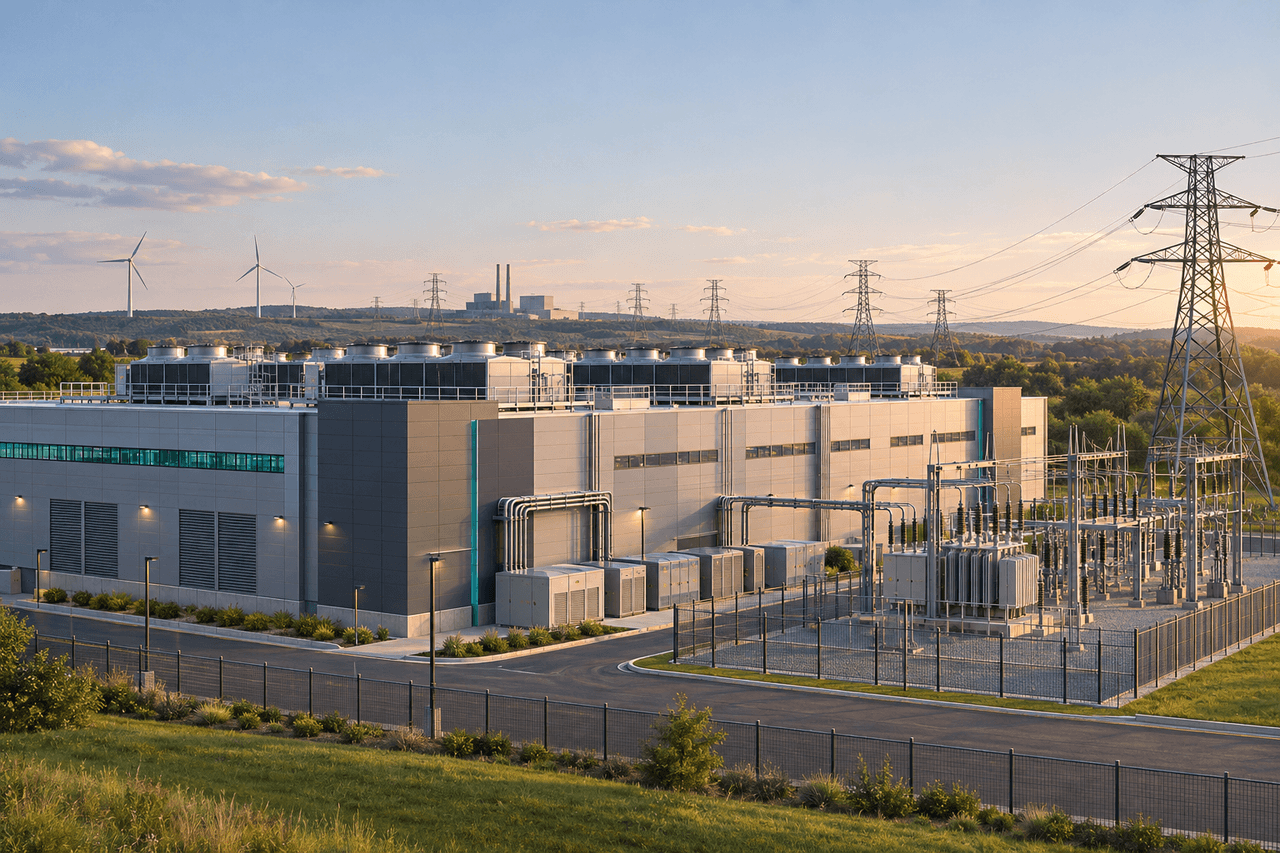
The companies racing to build data centers for artificial intelligence have hit a constraint that money cannot quickly fix: a new grid connection can take years. Increasingly, their workaround is to arrange gas-fired power of their own.
Developers have proposed 177 gigawatts of gas-fired capacity associated with U.S. data centers, according to an October inventory by Earthjustice and the Better Data Center Project. The number is better read as a measure of ambition than as a construction schedule. It counts proposals, some of which may never be financed. The arrangements include on-site generation and other dedicated power supplies, including some connected to the grid. Earthjustice report
The plants that do get built, and the hours they run once grid power arrives, have become a central unknown in the country's emissions outlook. A cleaner grid could coexist with a growing fleet of gas plants serving data centers outside it.
Study comparison
Compare power emissions and electricity demand
Choose CO₂ emissions or electricity demand, then highlight a study. Each source keeps its own units, accounting boundary and reported values. Dashed connectors illustrate endpoints without supplying missing annual data.
Two forecasts, different boundaries
The leading projections point in different directions, and they deserve different kinds of weight. Rhodium Group's July outlook projects a 22 to 27 percent decline in power-sector greenhouse-gas emissions from 2025 to 2030, even with substantial data-center growth. Sierra Club estimates that planned AI projects could push annual power-sector carbon dioxide emissions to 2.1 billion metric tons in 2030, about 42 percent above 2025. The projections cover different supply arrangements and use different emissions measures. Rhodium outlook · Bloomberg reporting
Rhodium's projected decline depends on adding an average of 48 to 50 gigawatts of solar, wind and storage a year through 2030, along with coal retirements and lighter use of the coal plants that remain. Its main limitation is structural: behind-the-meter generation, which sits on the customer's side of the utility meter, falls outside its grid model.
That omission matters most if dedicated gas plants are actually built. Rhodium's range is best read as a forecast for the grid rather than every plant serving data centers. Behind-the-meter facilities can still be connected to the grid.
Sierra Club's figure includes a large contribution from sources outside the grid, which is what makes it newsworthy. Bloomberg reported the group's internal calculation in coverage republished on October 29. Jeremy Fisher, Sierra Club's principal adviser for climate and energy, said sources not directly linked to the grid could contribute more than 460 million tons.
Bloomberg's account gives no project-by-project assumptions about completion rates, operating hours or overlapping proposals. Without those details and the underlying model, the estimate cannot be independently tested. The 2.1-billion-ton figure is a warning about a possible outcome, with important assumptions still to be disclosed.
Why the biggest numbers can't be added together
The most striking figures in this debate are also the easiest to misuse. Earthjustice and the Better Data Center Project estimate that the proposed gas capacity would emit more than 400 million metric tons of carbon-dioxide-equivalent a year. That unit converts several greenhouse gases into a common measure of warming effect; Sierra Club's reported figure uses carbon dioxide. Earthjustice summary and methodology
Adding the estimates would mix measures and risk counting projects in both inventories twice. They answer overlapping questions.
A subtler trap involves demand rather than plants. A campus counted as grid-served in a forecast might instead use its own gas plant. A national tally would need to remove that demand from the grid calculation when assigning it to dedicated generation.
The line between grid and off-grid is also blurrier than the labels suggest. Some dedicated arrangements include a grid connection, and Earthjustice expects most projects in its inventory eventually to seek grid service.
The cost hidden inside a falling total
A national total can fall while data centers still push it higher than it otherwise would have been. A study led by Jeremiah Johnson of North Carolina State University found that data-center and cryptocurrency growth could raise 2030 power-sector CO2 by up to 28 percent. That increase is measured against a hypothetical 2030 without the new demand, rather than against today. NC State research explanation
The researchers modeled electricity supply hour by hour across 26 regions of the contiguous United States. Their comparison estimates the effect of the computing boom under modeled conditions. It leaves open whether total emissions will rise or fall relative to today.
For regulators, that may be the more useful question. Whether the national total rises depends on coal retirements, renewable construction and demand across the economy. How much the new load adds, and how it is supplied, is decided project by project.
How much power is at stake
Even the size of the demand is uncertain, and the uncertainty is large relative to the industry itself. Lawrence Berkeley National Laboratory estimates that U.S. data centers used 192 terawatt-hours in 2024; its June reference case more than triples that to 649 terawatt-hours by 2030. Its combined uncertainty range is 521 to 843 terawatt-hours. Berkeley Lab report
The two leading studies are built differently, and averaging them would blur the picture rather than sharpen it. Berkeley Lab estimates demand from equipment shipments, server use and cooling, covering AI and conventional computing while excluding cryptocurrency. Its range turns on what equipment companies buy and how hard they run it.
The Electric Power Research Institute starts from commercial data on proposed developments and includes cryptocurrency mining. Its 2030 low, medium and high cases are 383, 596 and 793 terawatt-hours. The medium case assumes every project under construction, three-quarters of those in advanced planning and a tenth of those in early planning will be fully operational by 2030. EPRI cautions that its three cases may not be equally likely. EPRI estimates and assumptions
That makes EPRI's range partly a bet on the same bottlenecks the gas plants face: which buildings secure financing and power and finish construction.
This analysis uses Berkeley Lab's reference case as its yardstick: 457 terawatt-hours of added annual demand from 2024 to 2030, or about 52 gigawatts running continuously.
What a clean alternative would take
Supplying that growth with wind and solar is possible on paper and hard in practice. By JetsonsAge's calculation, an illustrative mix drawing 60 percent of the added energy from solar and 40 percent from wind would need about 130 gigawatts of solar and 62 gigawatts of wind. The estimate uses the Energy Information Administration's 2025 national capacity factors: 24 percent for solar and 33.8 percent for wind. Solar capacity is measured in alternating current. EIA capacity factors
Allowing for 5 percent delivery losses and a further 8 percent cut in usable output raises the need to about 149 gigawatts of solar and 71 of wind. Those allowances are illustrative, rather than engineering estimates. Both cases address growth since 2024; existing clean generation already serves some data-center demand.
Three obstacles stand between the arithmetic and a working supply.
Scale. The 130 gigawatts of solar equals almost five years of U.S. utility-scale installations at the 2025 pace of 27.2 gigawatts. Developers told EIA they planned 43.4 gigawatts of solar and 11.8 of wind for 2026, a faster clip but a statement of intent. That construction must also serve new factories, electric vehicles and replacements for retiring plants. Some clean capacity added since 2024 may already serve part of the growth. EIA additions report
Connection. Projects completed in 2025 waited a median of more than five years from first connection request to operation, in regions with available data, Berkeley Lab found. On paper, the pipeline is ample: 256 gigawatts of solar and 76 of wind held draft or executed interconnection agreements at the end of 2025. Those projects must serve all new demand, and an agreement still leaves financing and construction to be completed. Berkeley Lab queue study
The longer record is a caution. Of all capacity that sought a connection from 2000 through 2020, 13 percent was operating by the end of 2025 and another 10 percent remained active. That cohort includes many early-stage requests, so its outcome does not establish the prospects for projects that have agreements.
Hours, not years. A data center can buy as much renewable electricity as it uses in a year and still run on gas on a windless night. Matching every hour can draw on several sources. The International Energy Agency describes combining wind, solar and storage, with options such as hydro, geothermal or nuclear that can supply power on demand. IEA analysis
Duration drives the difficulty. Covering the average 52-gigawatt increase for four hours would take about 209 gigawatt-hours of usable storage; covering three days with no generation or imports would take about 3,756, eighteen times as much. A real plan would also have to account for weather, charging losses, outages and transmission limits.
The emissions benefit ultimately depends on operations, not purchases: how new supply changes the hours fossil plants run. Shifting computing work to other times or places, where the service allows, could reduce the need for fossil generation.
Gas has bottlenecks of its own
The case for on-site gas rests on speed, but gas plants face delays too. Rhodium constrains gas construction in its model through 2029 because of turbine shortages, a constraint that could also slow dedicated plants. Its outlook leaves out proposed nuclear projects too early in development to assign dependable dates, and begins scaling enhanced geothermal only in the early 2030s. Rhodium outlook
For a campus that needs power before 2030, that implies a practical standard: a supply plan tied to named plants, equipment orders and achievable connection dates. Longer-term plans can add projects as their schedules become verifiable.
The detail with the largest emissions consequences may be the least visible: what a "temporary" gas plant does after grid service arrives. A plant that runs only until the connection comes has a very different footprint from one that keeps running for decades. That makes a plant's post-connection operating plan as important to its emissions as its size.
Counting the costs
The renewable path's construction bill runs to hundreds of billions of dollars. At EIA's average costs for plants installed in 2024, $1,865 per kilowatt for solar and $1,882 for wind, the base mix would cost about $359 billion, and the case with added losses about $411 billion. Both figures are in 2024 dollars, before tax benefits. EIA construction costs
Those totals are not yet a fair comparison with gas. Storage, wider grid upgrades, financing, operation and equipment replacement would have to be assessed for both options over the same service life.
Gas carries a different exposure: a fuel bill that recurs every year. If gas supplied all 457 terawatt-hours of new demand, each $1-per-million-Btu change in fuel prices would move the annual bill by about $3.4 billion for combined-cycle plants, or $5 billion for less-efficient turbines. The estimate uses EIA's 2025 full-load heat rates; plant choice and operating conditions would change actual fuel use. EIA heat rates
That all-gas supply would emit about 182 million to 265 million metric tons of CO2 a year from combustion alone, excluding upstream methane. The calculation is a yardstick for comparing technologies, not a forecast. EIA carbon factor
Who is left holding the bill
Electricity customers also face the risk of a plan that fails. If a utility builds infrastructure for a data center that opens late or is canceled, other customers can end up paying for it.
Federal regulators have started to address that risk. In June, the Federal Energy Regulatory Commission issued six preliminary show-cause orders asking regional grid operators to justify or reform their rules for connecting large loads. Faster connections and consumer safeguards are among its stated objectives; the proceedings remain open. FERC orders
Regulators weighing an individual campus's power plan have tools of their own. They can require a dated supply schedule and a contract that assigns the cost of delay or cancellation, through minimum payments, financial security and developer responsibility for customer-specific upgrades. Those terms set how much a developer pays if its promised demand never arrives, and how much everyone else does.
The national forecasts will keep diverging until their assumptions can be tested. In the meantime, the emissions outcome for 2030 is being set project by project, in the supply plans and contracts regulators approve.
Sources · 15
- https://earthjustice.org/feature/data-center-byop-energy-report
- https://rhg.com/research/taking-stock-2026/
- https://amp.insurancejournal.com/news/national/2026/10/29/890656.htm
- https://earthjustice.org/document/the-ai-gas-rush-risks-and-implications-of-bring-your-own-power-executive-summary
- https://news.ncsu.edu/2026/05/data-centers-power-bills/
- https://www.energy.gov/documents/united-states-data-center-energy-usage-report-2025-update
- https://powering-intelligence.epri.com/executive-summary.html
- https://www.eia.gov/electricity/monthly/epm_table_grapher.php?t=table_6_07_b
- https://www.eia.gov/todayinenergy/detail.php?id=67205
- https://emp.lbl.gov/queues/
- https://iea.blob.core.windows.net/assets/3179f7f8-01f6-4dd6-bffa-c9f7b73f1dc9/KeyQuestionsonEnergyandAI.pdf
- https://www.eia.gov/electricity/generatorcosts/
- https://www.eia.gov/electricity/annual/table.php?t=epa_08_02.html
- https://www.eia.gov/electricity/annual/table.php?t=epa_a_03.html
- https://www.ferc.gov/cost-transparency-customer-protection