Google’s ForTy map shows why tree cover is only the beginning
A 10-meter map distinguishes natural forests, managed stands and tree crops. The research shows both the value and the difficulty of reading land-use history from space.
Published October 24, 2026Analysis / Artificial Intelligence / Predictive Analytics
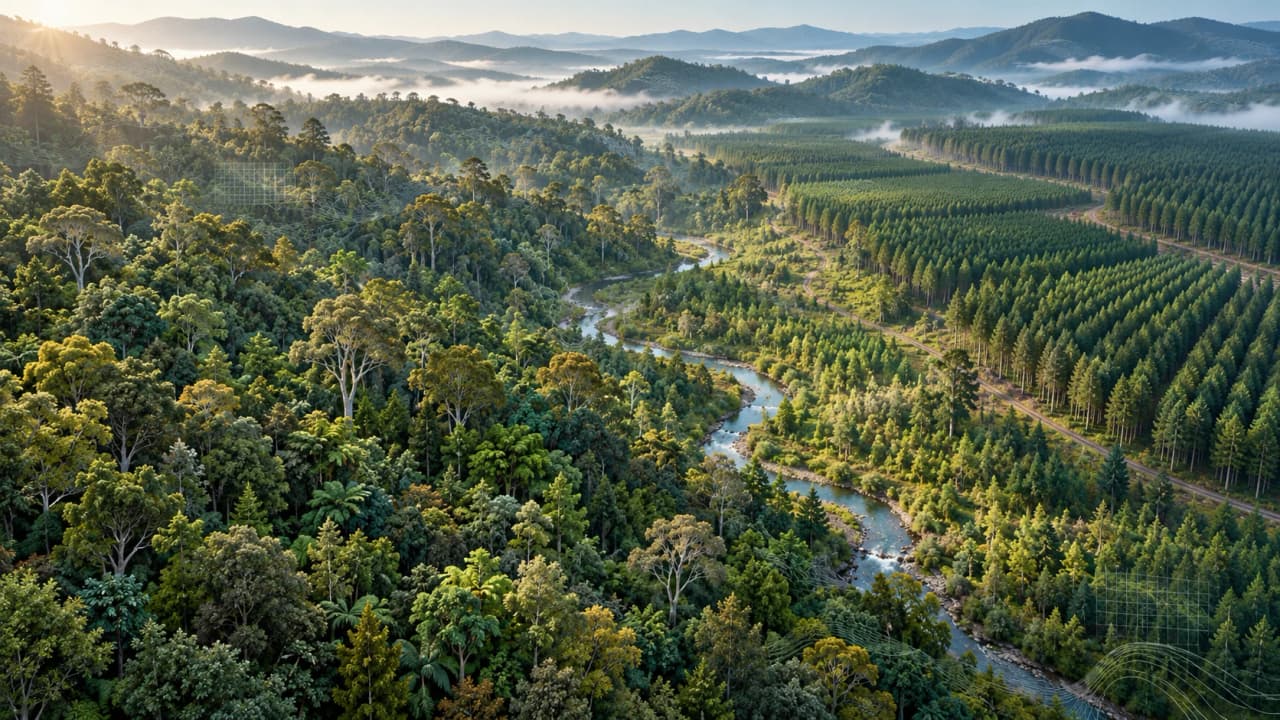
A timber plantation can be green, dense and full of trees while telling a very different story from the natural forest it replaced. A map of tree cover can record clearing and regrowth yet leave the change in the land’s purpose unresolved. For conservation, that missing distinction matters: the return of a canopy and the recovery of a forest ecosystem are different questions.
Google’s Forest Typology map, or ForTy, tackles that gap. Announced on October 22, 2026, the work brings Google DeepMind and Google Research together with the World Resources Institute and the International Institute for Applied Systems Analysis. Its central product describes forest types in 2020 on a 10-meter grid: each pixel represents a square of ground 10 meters, or roughly 33 feet, on each side.
ForTy’s significance lies in the distinctions assigned to those squares. It gives analysts a common framework for distinguishing naturally established forests, planted stands and tree-based agriculture. The evidence also exposes the difficulty of that task. Trees reveal their height, arrangement and seasonal behavior more readily than they reveal who planted them, why they were planted or how the land has been managed.
What the extra categories add
High-resolution mapping already exists. ESA WorldCover maps land cover at approximately 10 meters, but its tree-cover class includes plantations and crops such as oil palm and olives. That is a reasonable grouping for describing the physical surface. It leaves a harder task for anyone asking whether a wooded area is a natural ecosystem, a timber operation or a farm.
The widely used Hansen Global Forest Change dataset addresses another part of the problem. At roughly 30-meter resolution, it maps tree cover and identifies stand-replacement loss. A loss signal records a major disturbance; identifying what the land becomes requires additional information. ForTy adds a vocabulary for that next question.
Its six categories are:
Primary forest: native forest with no visible indications of human disturbance.
Naturally regenerating forest: forest established mainly through natural regrowth, including secondary forest.
Planted forest: predominantly planted or seeded forest, operationally associated with rotations longer than 40 years.
Plantation forest: intensively managed stands, usually of one or two species, with regular spacing and even ages, using a rotation threshold of 40 years or less.
Tree crops and agroforestry: agricultural systems growing commodities such as oil palm, rubber or fruit.
Other land: the remaining land-cover and land-use types, including sparse woody vegetation and tree patches below forest thresholds.
These categories make the word “restoration” more demanding. Counting additional tree-covered area cannot, by itself, establish whether natural regeneration is returning or a plantation is expanding. Separating those outcomes allows a more useful account of what changed. Forest type remains one input to ecological assessment: carbon stocks, species richness and habitat condition require their own measurements. A class label organizes the questions that follow.
A model learns clues to history
The system uses AlphaEarth Foundations, which compresses satellite observations into numerical descriptions of each location. ForTy learns from about 1.7 million training examples, bringing together surveys, existing datasets and targeted expert review. The point of using observations across time is to give the model more evidence than a single green canopy: planting patterns and growth or harvest cycles can help distinguish land uses.
This is an inference problem. A model can recognize regular rows, but management history is only partly visible from above. The 40-year division between planted and plantation forest is an operational proxy for a distinction that also involves management intensity. Mature secondary forest can resemble primary forest, while coffee or cocoa beneath a native canopy can resemble natural forest. These are meaningful ambiguities in the landscape, reflected in the dataset’s documented limitations.
Ten-meter pixels should therefore be understood as the spacing of the output grid. They give the map useful detail, while the ecological and management claims still depend on the evidence behind each prediction. A crisp edge on a screen can make an uncertain interpretation look more settled than it is.
What the accuracy figures establish
The Scientific Data paper, published October 21, reports 90.2% overall accuracy across six classes. That estimate uses 8,190 sites resolved by expert consensus from an initial stratified sample of 9,100. Two experts interpreted high-resolution imagery, satellite time series and contextual data; the reported assessment concerns each site’s central 10-meter pixel. Unresolved and uncertain sites were excluded, with difficult managed classes disproportionately represented.
The overall score is strongly influenced by the extensive “Other” category. Planted forest achieved an F1 score of 58.2%, reflecting confusion with both naturally regenerating forest and plantations. F1 combines precision—how often an assigned label is right—with recall—how much of the actual class the model finds. It is a different measure from overall accuracy. The exclusions and uneven class performance make the headline percentage a poor substitute for checking the category of interest.
For a fairer comparison with existing forest-type mapping, the researchers also harmonized the labels into four classes. They merged planted and plantation forests, and grouped tree crops with other land. On the same validation dataset, ForTy reached 90.9% overall accuracy against 87.8% for the Joint Research Centre’s GFT2020 v1 map—a 3.1-percentage-point improvement. That comparison supports a concrete advance under shared evaluation conditions.
It also keeps the claim in proportion. JRC already maps forest types by combining existing datasets, and its risk-assessment map includes plantations within planted forest. ForTy extends the available distinctions and offers evidence of improved performance on a compatible test. Comparing its six-class headline score with an unrelated map’s published accuracy would mix different questions and samples.
The release includes confidence scores for each class, which lets analysts inspect competing interpretations rather than accept only the winning label. Those scores are uncalibrated: a normalized confidence score of 0.8 has not been established as an 80% chance of correctness. Their practical value is in exposing ambiguity and supporting thresholds tested against suitable reference data.
A baseline and an early account of change
The published baseline represents 2020. Google also released an early annual series covering 2017–2025. Its viewer identifies this as ForTy V2 Beta, an experimental release with seven classes, splitting primary forest into mature and regrowing categories. It warns that the assets and class definitions may change. The six-class baseline’s validation therefore belongs to a different version and classification scheme.
Annual estimates can describe sequences of land-use change, but each transition between labels introduces a further question: did the land change, or did the classification change? The announcement describes continued improvements to the series; its availability today and its experimental status both matter.
That distinction matters when interpreting a pixel that moves from natural forest to plantation. The transition is a lead to examine alongside observations and local evidence. Annual maps describe past periods and become available after processing; they provide a different timescale from live alerts about clearing.
Access is practical today. The 2020 data on Figshare is licensed under CC BY 4.0 and distributed as cloud-optimized GeoTIFF archives, covering land between 65°S and 84°N. The Earth Engine catalog provides an analysis entry point, and a browser viewer offers a way to explore the baseline.
ForTy’s contribution is a more discriminating account of the world’s wooded land. It makes it possible to ask whether green returning to a map represents natural recovery, planted forestry or agriculture—and to examine how confidently the available observations support the answer. That is a useful step toward judging forest change by what is recovering or being replaced, alongside how many trees remain.
Sources · 10
- https://deepmind.google/blog/beyond-tree-cover-mapping-the-worlds-forest-types/
- https://esa-worldcover.s3.eu-central-1.amazonaws.com/v200/2021/docs/WorldCover_PUM_V2.0.pdf
- https://developers.google.com/earth-engine/datasets/catalog/UMD_hansen_global_forest_change_2025_v1_13
- https://developers.google.com/earth-engine/datasets/catalog/projects_nature-trace_assets_forest_typology_forest_typology_2020_v1_0_collection
- https://www.nature.com/articles/s41597-026-08299-5
- https://www.nature.com/articles/s41597-026-08299-5/tables/13
- https://forobs.jrc.ec.europa.eu/GFT
- https://nature-trace.projects.earthengine.app/view/forest-typology
- https://plus.figshare.com/articles/dataset/_i_Forest_Typology_2020_v1_i_/32288616
- https://nature-trace.projects.earthengine.app/view/forest-typology-2020